Trending areas and a calendar for satellite overpasses – the October update released!
What’s new?
In case you were wondering what are the hottest locations for satellite monitoring recently – we got you covered! We have just released a new version of the app, which includes an option to display trending areas all around the world. We hope this will help when trying to stay up-to-date with the most recent events. A second functionality that we bring this month is a calendar view, which is a long-awaited feature by many of you so we hope you’ll like it!
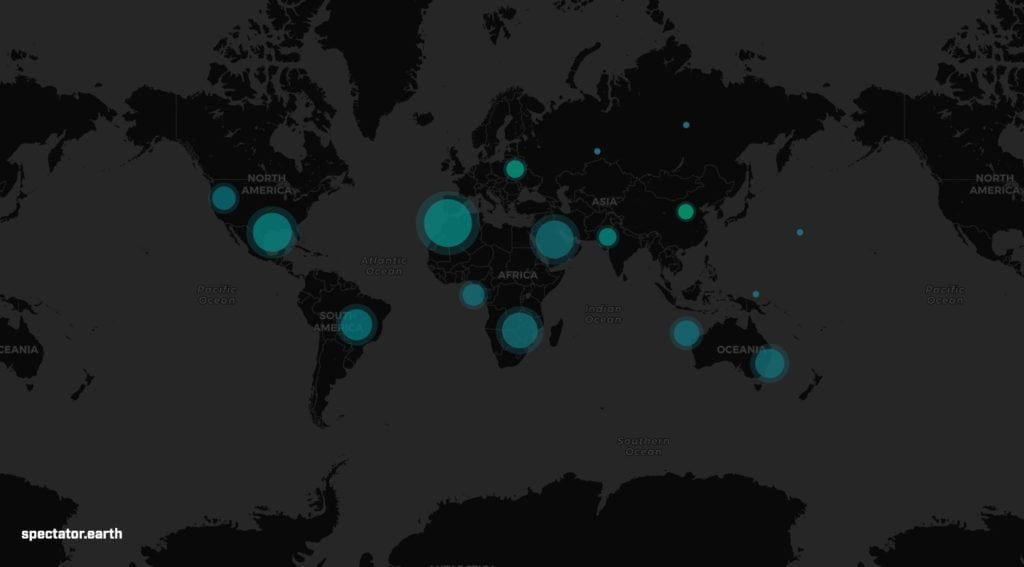
Trending areas
When looking for new areas to explore with satellite images, you can now use the “Trending” button on the main page to discover the most popular locations from the last week.
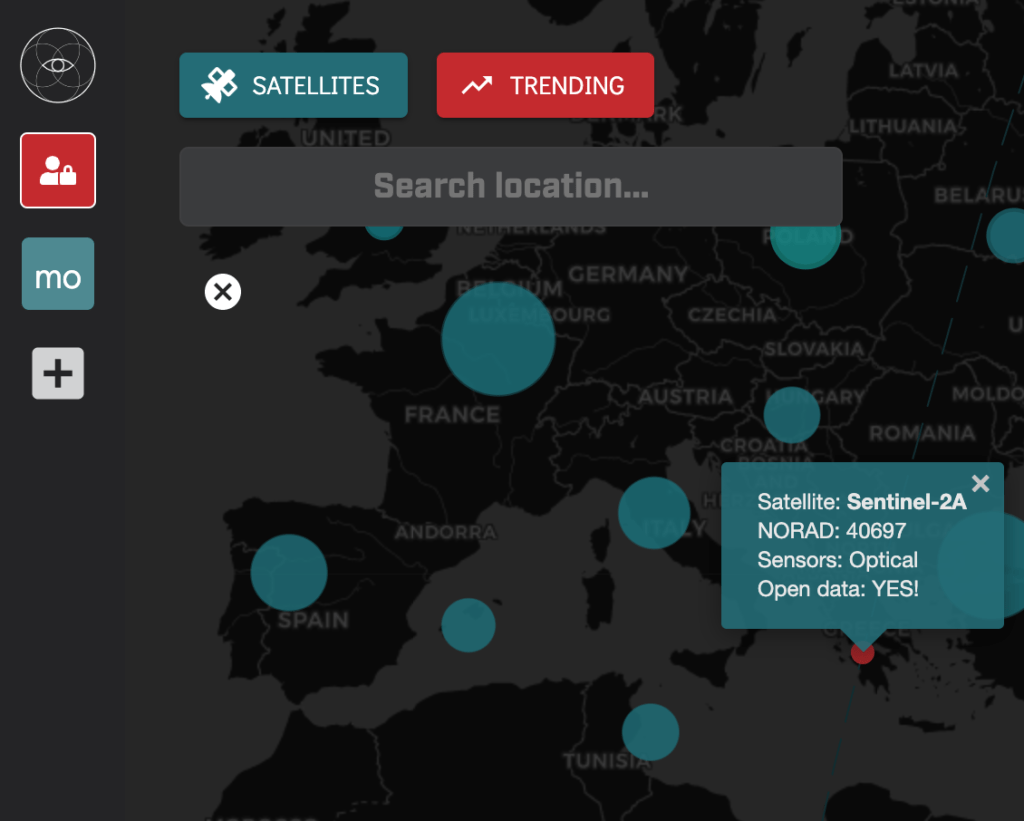
You can access this layer from “Create observation” view. The clusters will be overlaid on your main map. When clicking the cluster you’ll zoom in to the bounding box of all the locations falling into this cluster. The clusters are colour-coded from green to red to indicate how “hot” the area is.
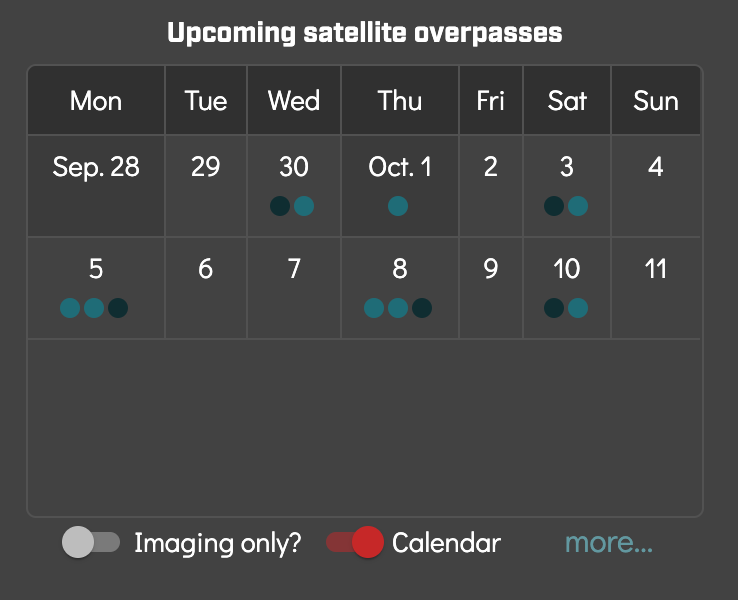
Calendar view for satellite overpasses
When displaying satellite overpasses you can now switch to calendar view, which sometimes may be easier to read and should make acquisition planning easier. The satellites are now colour-coded, so each dot represents an overpass in a given day for one satellite.
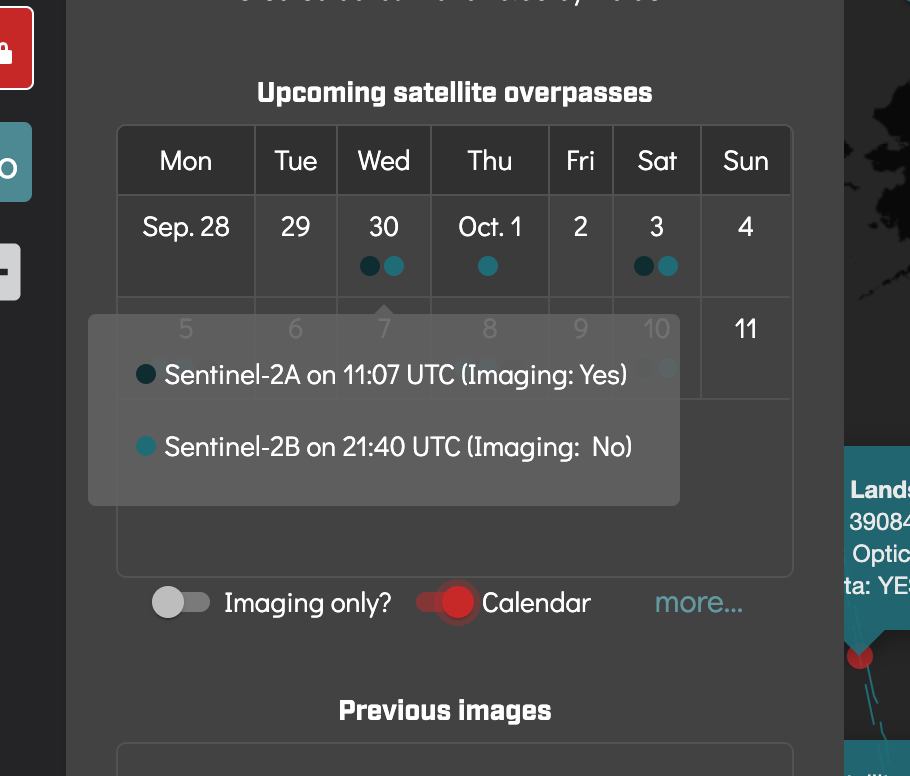
Hovering over the calendar cell, you’ll get details regarding the overpasses on this day. Satellite name, UTC and whether the satellite is imaging or not.