Displaying Sentinel-2 image on a Leaflet map
Basic Leaflet example
To keep it as simple as possible we’ll use the Leaflet landing page example that can be found at https://leafletjs.com/
Now without changing the location or any other parameters, the question is…
How do we put Sentinel-2 image on a Leaflet Map using API.spectator.earth?
First, we’ll need a Sentinel-2 image for London, which is the default location in the Leaflet example. To make it easier for your here‘s an observation with 2 cloudless images over London. Second, if we look at our API docs, we’ll need to find parameters for the URL for our Sentinel-2 tile layer. Here’s an example URL:
https://api.spectator.earth/imagery/<IMAGE_ID>/tiles/{z}/{x}/{y}/?bands_formula=b04,b03,b02&api_key=<YOUR_API_KEY>
The parameters that we need to provide are
- Image ID(that’s an internal spectator.earth ID for each image)
- Your API key(your API key ;))
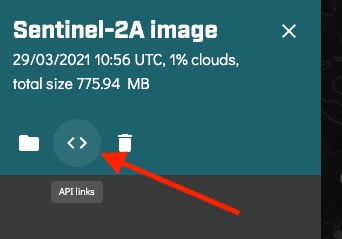
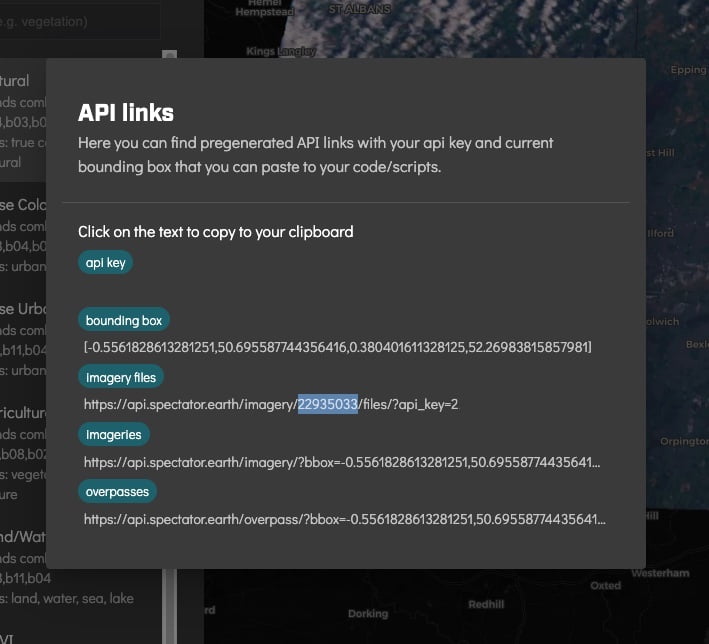
The easy way to find the image ID and your API key is to use the APP and the API links view. The view is available for every image after clicking

Alternatively, if you want to automate things, you can get image IDs from the API. Notice that for bands combination we’ll use the default RGB formula, which in the case of Sentinel-2 is b04, b03, b02. Of course, you can change that to, for example, display an NDVI image. If you’re not very familiar with satellite imagery or don’t know what bands are, we recommend our previous post which will give you a light explanation of what we’re talking about here.
Putting it all together in 10 lines of code
Now we can put all this together in JS, which should give us a map as presented below. Don’t forget to put your API key there!
const OSMlayerURL = 'https://{s}.tile.openstreetmap.org/{z}/{x}/{y}.png';
const londonLatLng = [51.5, -0.09];

const imageId = '22935033'
const apiKey = 'put your API key here';
const bandsFormula = encodeURIComponent('b04,b03,b02');
const imageTilesURL = `https://api.spectator.earth/imagery/${imageId}/tiles/{z}/{x}/{y}/?bands_formula=${bandsFormula}&api_key=${apiKey}`;

const map = L.map('map').setView(londonLatLng, 13);

L.tileLayer(OSMlayerURL).addTo(map);
L.tileLayer(imageTilesURL).addTo(map);
L.marker(londonLatLng).addTo(map).bindPopup('A pretty Sentinel-2 image.').openPopup();
NOTE: when using expressions for NDVI or other indices you need to pass an additional parameter to rescale the image. The URL then becomes:
const imageTilesURL = `https://api.spectator.earth/imagery/${imageId}/tiles/{z}/{x}/{y}/?bands_formula=${bandsFormula}&api_key=${apiKey}&rescale=-1,1`;That’s it!
Now you can play with other locations and/or band formulas. If you have any questions/suggestions, send us an e-mail at hello@spectator.earth or contact us via social media!