How to download the latest satellite images?
Although we do our best to simplify taking images from satellites to be as easy as taking them from your smartphone, there is a couple of differences worth learning before you start working with space-based data.
TL;DR
For those who simply want a quick tutorial on how to get the most up to date satellite image over a chosen area of interest, below you’ll find a short video showing how to do it. In the rest of this post, we’ll discuss in details a couple of important basic aspects of working with this type of data.
The difference between satellite imagery and your Instagram photos
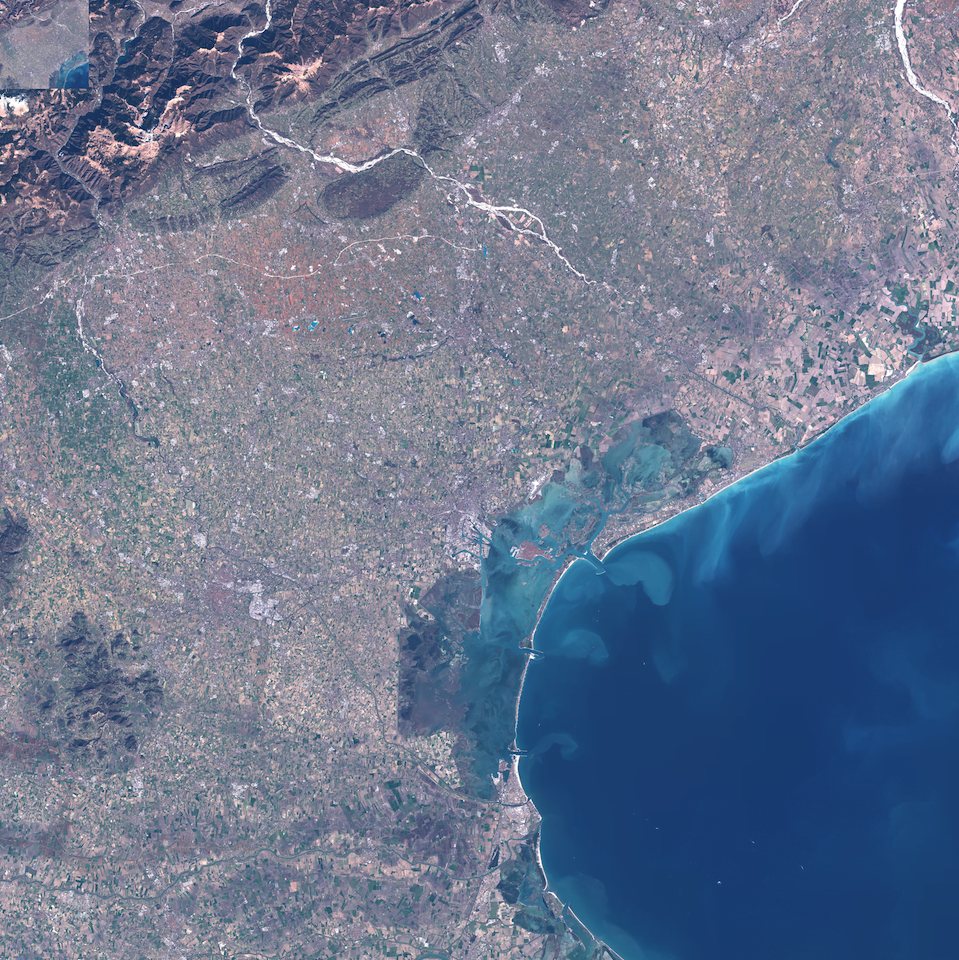
What we’re all used to in everyday life are colour images. Those are usually built from a combination of three main colours: red, green and blue. That’s why you’ll often hear about RGB(Red, Green, Blue) images. You’ll also sometimes hear, people don’t call them colours, they call them channels or bands. Usually, you don’t bother about bands as all you care about is a colour product that should try to represent what you see with your eyes. It’s a bit different when working with satellites and you usually want them separated. Why? Avoiding deep dive into physics, for the sake of simplification, let’s just say that the light as we know it is really a combination of multiple bands. Sometimes it happens that the light is split into its base components when e.g. passing through water particles and we see something like this:

The satellite imagery is usually recorded in multiple files storing multiple bands separately. Some of these bands fall outside of the visible spectrum (the part that we can see with our own eyes). There are a lot of advantages in knowing how to operate with these bands but all you need to know for now is that spectator.earth combines available bands on the fly for ease of use and visualisation. It also gives you access to raw data allowing for custom arrangement of the bands.
Downloading RGB image
There are 3 ways to get an RGB image depending on how advanced a user you are:
- Downloading image visualised in the interface
- Downloading True Color Image in full resolution(only for Sentinel-2 satellite images)
- Accessing bands and bands combinations from the API
The video at the beginning shows how to accomplish 1 and 2 and here we’ll focus on going into details on these options. For option number 3, you’ll find an extra at the end of this post.
Choosing the right image
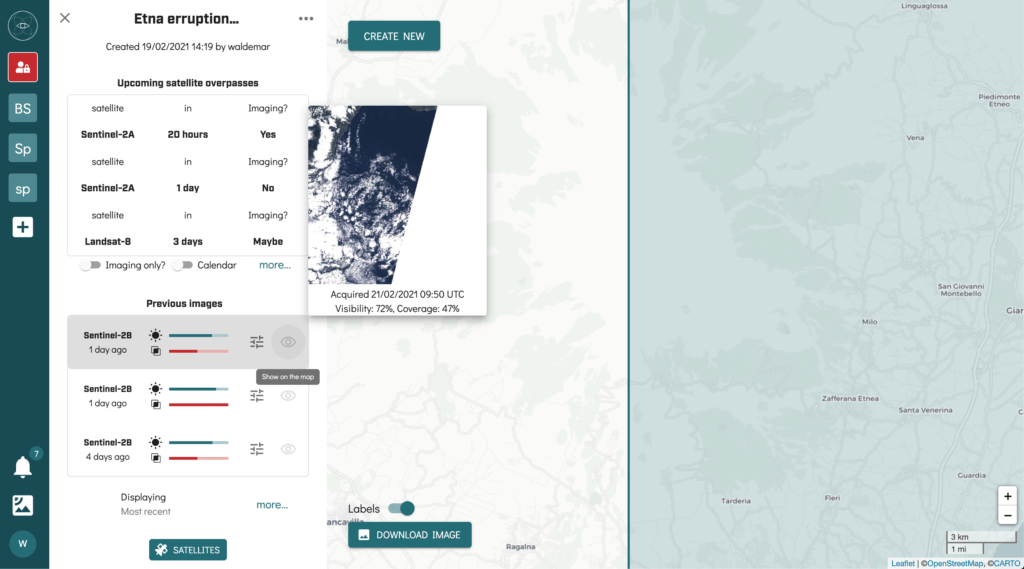
Before we define our area of interest it’s worth creating a free account, since a lot of filters and data are available only for logged in users. Once we’re in the app, after choosing the area of interest you’ll see a list of available archive imagery and information about future satellite overpasses and planned imaging.
To visualise any of the images on the map, you need to click on the eye icon on the list. You can visualise multiple acquisitions if you need to. This may be helpful for larger areas, or areas that fall on the multiple acquisitions overpasses.
The two most important things that have to be considered when looking for an image is:
- visibility
- area coverage
Visibility
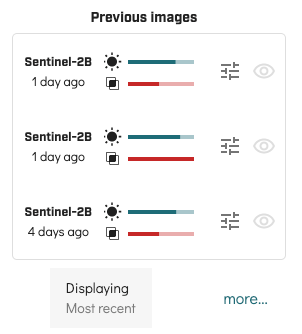
The green bar on the list, next to the sun icon, represents the percentage value of the image area that is free from clouds.
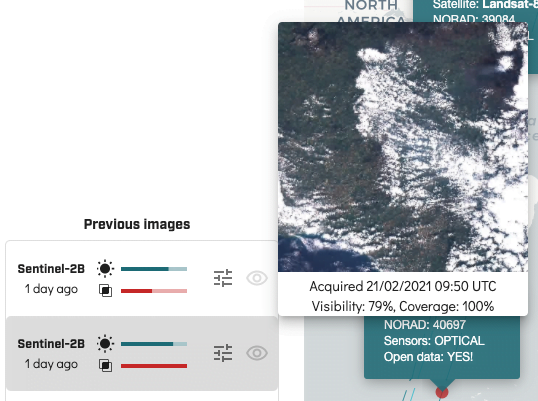
It should be noted, that this value is computed for the whole image, which may have an area of hundreds of squared kilometres. Therefore, indicated visibility may be relatively low but, e.g. a city that you’re looking for is still visible. It’s always worth checking the preview thumbnail which is available when hovering over the list element.
Coverage
It often happens that the satellite during a particular overpass will image only a part of the area that we’re interested in. This coverage is indicated by the red bar on the list representing the percentage area coverage. When hovering over the element, a green polygon on the map will also indicate the bounding box of the acquisition.
Downloading the image
At any given moment we may take a snapshot of the current map view using the download image button in the lower-left corner of the map. This allows us to quickly download the currently visualised satellite image or images.
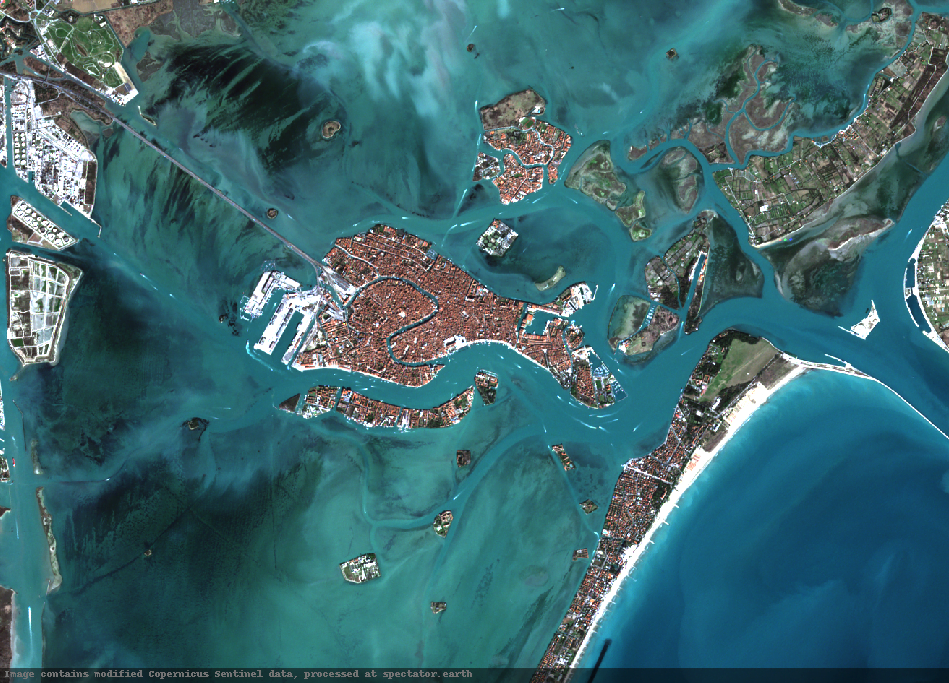
If, however, we would like to download a full-resolution RGB image, it is possible when using Sentinel-2 satellites, taking advantage of the true colour image file that comes with all acquisitions. To do so, click the filter icon on the selected image, and choose the folder icon from the imagery header. You’ll see a long list of files and the one that you’re looking for is TCI.jp2, which is a combination of red, green and blue channels for the whole image.
Whenever downloading the raw data, it will come in full resolution for the whole acquired area and it won’t be very optimised in terms of colour balance etc. Unless you’re looking for advanced usage, it’s often much easier to simply use the graphical interface.
Using API.spectator.earth and building your own band combinations in Python
For a bit more advanced users, here is an example Python notebook, that shows how to use our API to create custom band combinations yourself:
Sentinel-2 band mixing in Python using API.spectator.earth
Ordering high-resolution imagery from the app
You can also order high-resolution imagery when looking for a more detailed view of your area of interest. Go to our FAQ for more information.